Visualizing data with raincloud plots

Table of Contents
Motivation
I love effective data visualization that combines the distribution of the data, individual data points, and summary statistics. I recently discovered a new tool for doing just this, with the R package {raincloudplots}. The ‘rain’ stands for the raw data, and the ‘cloud’ stands for the data distribution. In this post, I showcase my first raincloud plot, and how to recreate it.
Step 1: Install {raincloudplots}
First, we’ll install the raincloudplots package from GitHub and load it.
if (!require(remotes)) {
    install.packages("remotes")
}
remotes::install_github('jorvlan/raincloudplots')
library(raincloudplots)
Step 2: Simulate some data
In one of my research projects, I’m planning to explore whether crowdsourced data analysis, also known as multi-analyst studies — giving the same dataset to different teams of scientists, who independently analyze it to answer the same research question — can increase the sway and credibility of scientific research. That is, are the results of multi-analyst (vs. single-analyst) studies more likely to sway someone’s prior beliefs?
Give me some more background information on the data and research setting
Before reading the results of a scientific study, study participants will report their prior beliefs in a specific phenomenon on a scale of 0% (very unlikely) to 100% (very likely).
graph LR
A[Report <br> prior beliefs]
A ==>B[Read <br> single-analyst results]
A ==>C[Read consistent <br> multi-analyst results]
A ==>D[Read inconsistent <br> multi-analyst results]
E[Report <br> final beliefs]
B ==> E
C ==> E
D ==> E
style A fill:#f6d4d1,stroke:#333,stroke-width:4px
style B fill:#f6d4d1,stroke:#333,stroke-width:4px
style C fill:#f6d4d1,stroke:#333,stroke-width:4px
style D fill:#f6d4d1,stroke:#333,stroke-width:4px
style E fill:#f6d4d1,stroke:#333,stroke-width:4px
Afterwards, study participants will be randomly allocated to one of three groups: one group will read the results of a conventional, single-analyst study; one group will read the results of a multi-analyst study with consistent results; one group will read the results of a multi-analyst study with inconsistent result.
After reading the study results, the study participants will again report their belief in the phenomenon on a scale of 0% (very unlikely) to 100% (very likely).
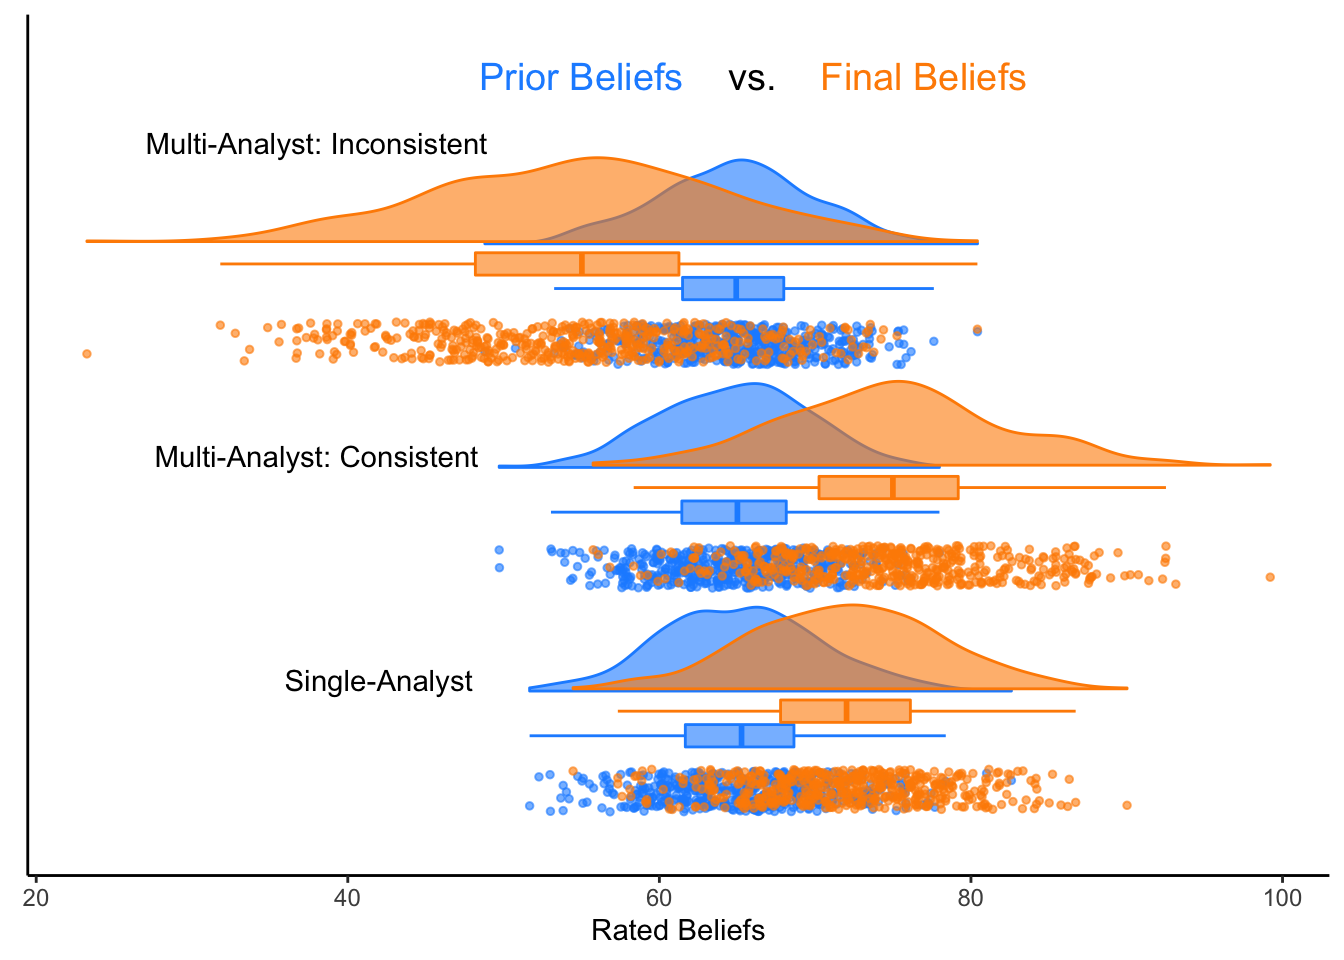
Below, I simulate some data that are in line with the hypotheses we’re planning to preregister: we expect that, compared to single-analyst studies, multi-analyst studies with inconsistent, highly variable results will negatively affect prior beliefs (i.e., research consumers will be less likely to believe in the reported phenomenon), while multi-analyst studies with consistent, positive results will positively affect prior beliefs.
Give me some more information about the simulation
For the prior beliefs of all three participant groups, we’ll make 500 random draws from a normal distribution with 𝜇 = 65 and 𝜎 = 5.
For the final beliefs of participants reading a single-analyst study, we’ll draw from a normal distribution with 𝜇 = 72 and 𝜎 = 6. For the final beliefs of participants reading a multi-analyst study with consistent results, we’ll draw from a normal distribution with 𝜇 = 75 and 𝜎 = 7.
For the remaining group (the inconsistent multi-analyst condition), we’ll draw from a normal distribution with 𝜇 = 55 and 𝜎 = 9. This reflects our hypothesis that beliefs in a phenomenon will decrease after observing a multi-analyst study with highly variable results.
set.seed(3)
prior <- replicate(n = 3, rnorm(n = 500, mean = 65, sd = 5))
final_single <- rnorm(n = 500, mean = 72, sd = 6)
final_multi_consistent <- rnorm(n = 500, mean = 75, sd = 7)
final_multi_inconsistent <- rnorm(n = 500, mean = 55, sd = 9)
Step 3: Initialize the data-format
For this step, you’ll need to choose between several possible designs that you can find here: e.g., a 1-by-1, 2-by-2, or 2-by-3 (repeated measures) raincloud. In my case, I have 3 different groups (the single-analyst condition, the consistent multi-analyst condition, and the inconsistent multi-analyst condition) with 2 measures each (prior beliefs and final beliefs), so I’m creating a 2 x 3 raincloud.
The {raincloudplot} function to set up the desired data format for a 2 x 3 raincloud is called data_2x2(). (Confusing, I know). For other options and how to initialize them, check out this page.
df_2x3 <- data_2x2(
  array_1 = prior[,1],
  array_2 = final_single,
  array_3 = prior[,2],
  array_4 = final_multi_consistent,
  array_5 = prior[,3],
  array_6 = final_multi_inconsistent,
  labels = (c('Prior Beliefs','Final Beliefs')),
  jit_distance = .09,
  jit_seed = 321)
Step 4: Make it rain! 🌧
Finally, we’ll use the raincloud_2x3_repmes() function to create our 2x3 raincloud.
colors <- rep(c("dodgerblue", "darkorange"), 3) #choose colors

raincloud_2x3_repmes(
  data = df_2x3,
  colors = colors,
  fills = colors,
  size = 1,
  alpha = .6,
  ort = "h") + #set to v for vertical plot

  scale_x_continuous(
    breaks = c(1,2,3),
    limits = c(0.8, 4.3),
    labels = rep("", 3)) +
  ylab("Rated Beliefs") +

  annotate(geom = "text",
           label = "Single-Analyst",
           x = 1.5, y = 42) +
  annotate(geom = "text",
           label = "Multi-Analyst: Consistent",
           x = 2.5, y = 38) +
  annotate(geom = "text",
           label = "Multi-Analyst: Inconsistent",
           x = 3.9, y = 38) +
  annotate(geom = "text",
           label = "Prior Beliefs",
           x = 4.2, y = 55, size = 5,
           color = "dodgerblue") +
  annotate(geom = "text",
           label = "vs.",
           x = 4.2, y = 66, size = 5) +
  annotate(geom = "text",
           label = "Final Beliefs",
           x = 4.2, y = 77, size = 5,
           color = "darkorange") +

  theme_classic() +
  theme(axis.ticks.y = element_blank(),
        axis.text = element_text(size = 9),
        axis.title.y = element_blank())
And we’re done! For more options and information, feel free to check out the paper cited below. A huge thank you to the {raincloudplots} package developers.❤︎
Acknowledgements
Allen M, Poggiali D, Whitaker K et al. Raincloud plots: a multi-platform tool for robust data visualization [version 2; peer review: 2 approved]. Wellcome Open Res 2021, 4:63. DOI: 10.12688/wellcomeopenres.15191.2
Shilaan Alzahawi
PhD candidate in Organizational Behavior
My research interests include leadership, team science, and open science